

Know how your company reads next to its peers
Investors compare your figures with your peers’ before they talk to you. Clarifo puts both side by side, each figure linked to the report it came from.
Follow what peers report during earnings season and see how they word the same disclosures.

From peer figures to a finished slide
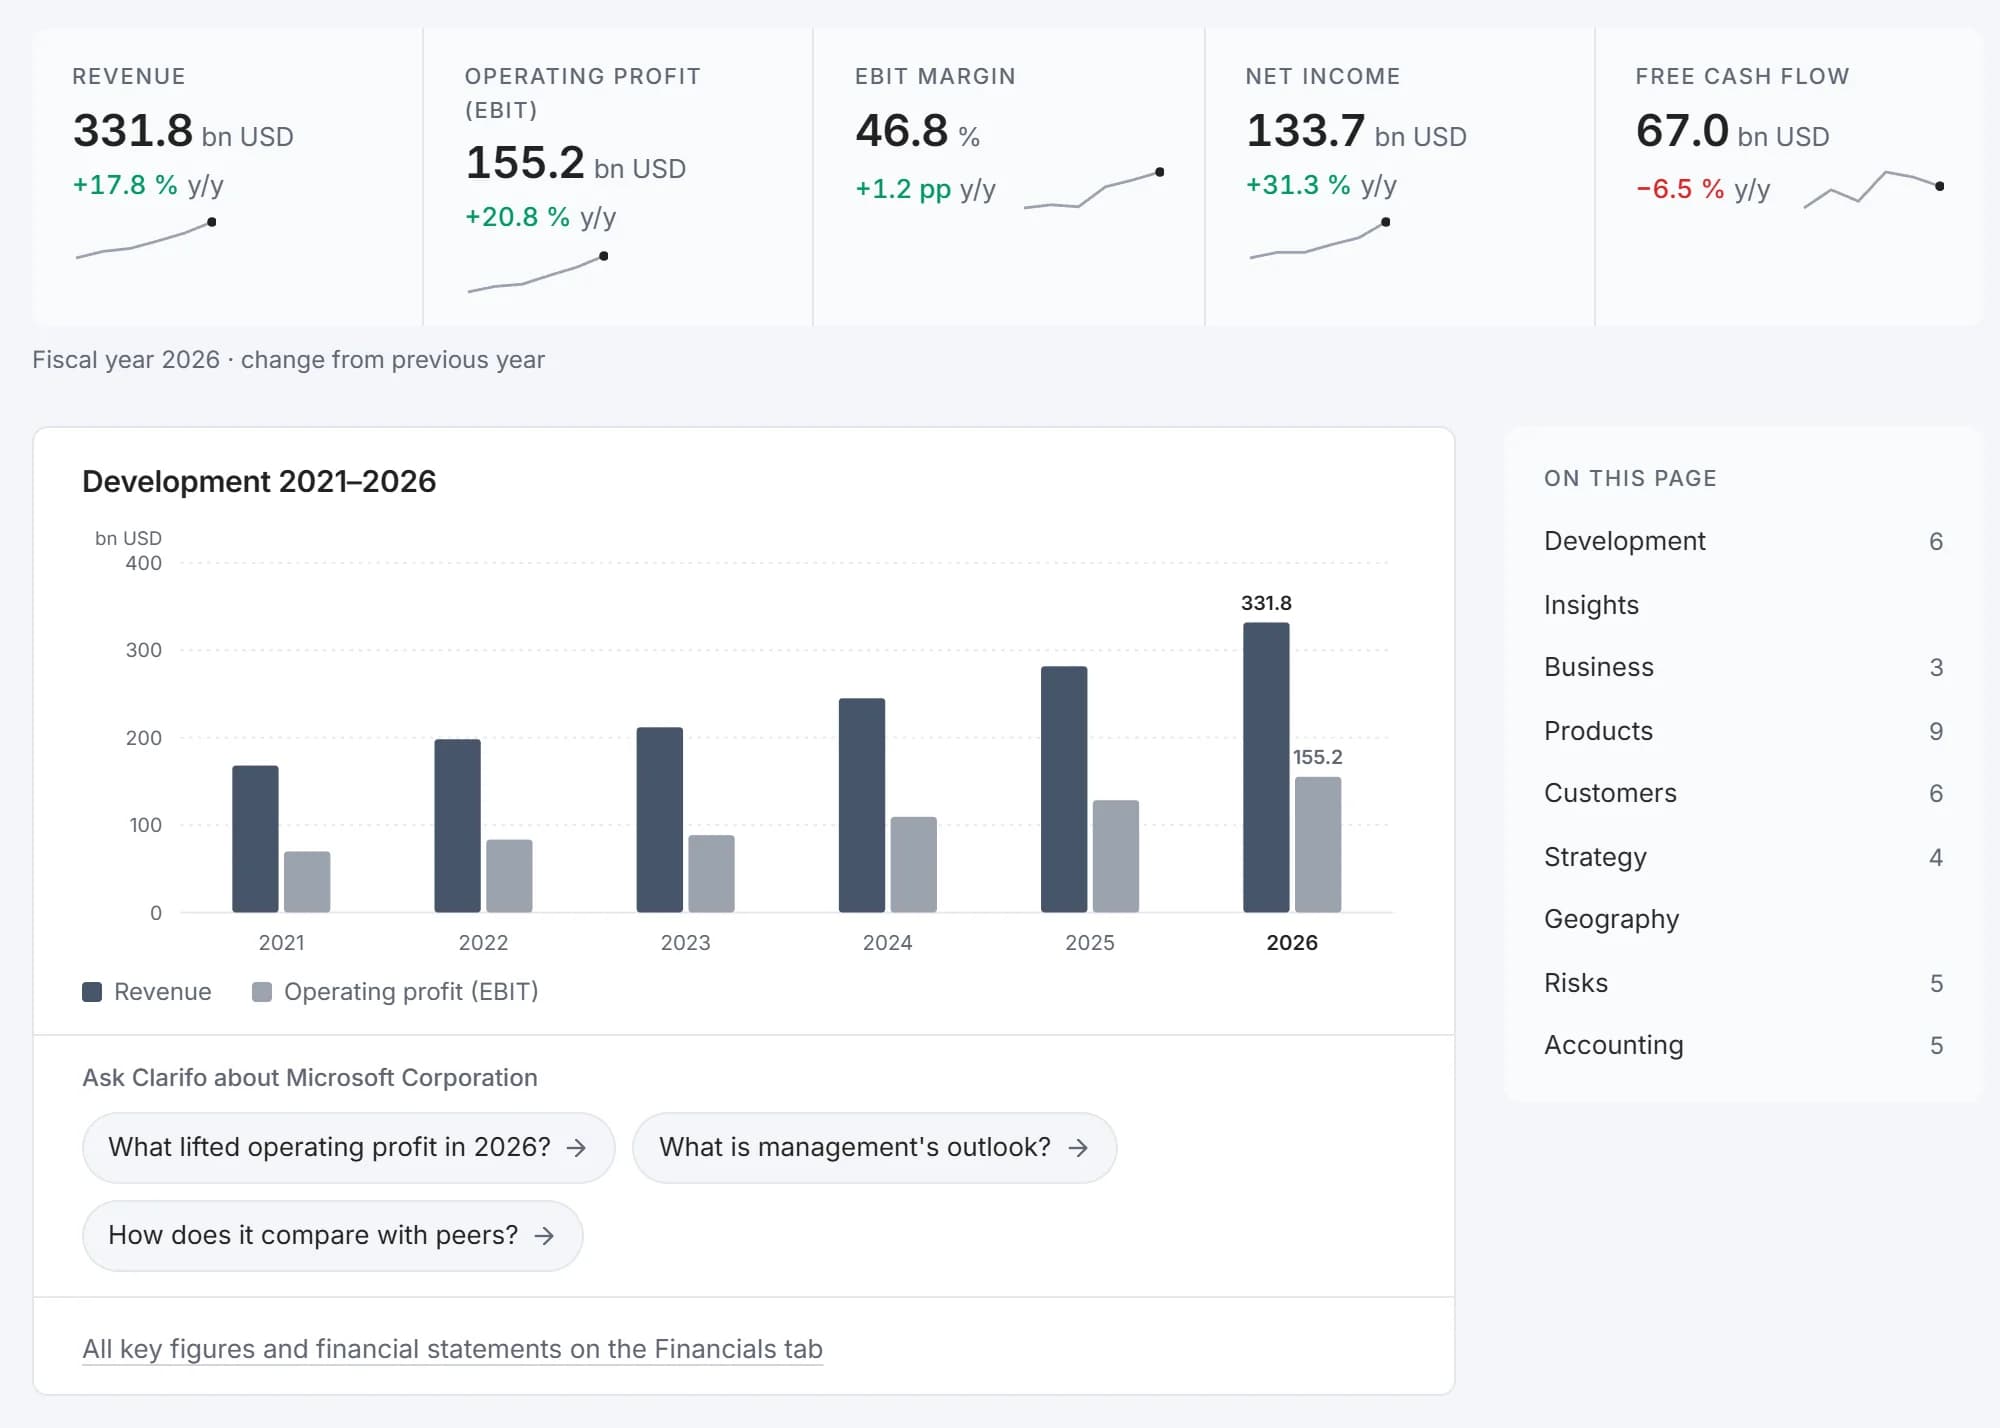
Your company and its peers in one table
See your key figures and your peers’ for the same periods, in one consistent format.
- Income statement, balance sheet and cash flow for each company
- Sector peer groups
- Segments and revenue by geography
Earnings season without the tab overload
Keep up when your peers report in the same week as you.
- A report calendar built from the companies' own financial calendars
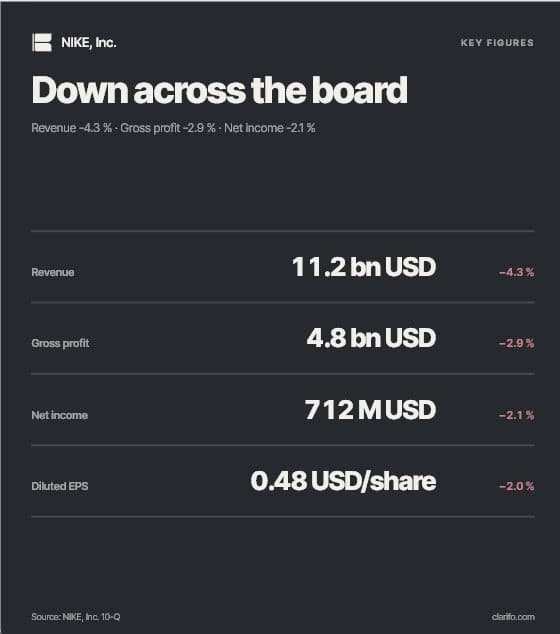
- Companies that just reported, as a Visual Story
- Visual Story cards to share with management
How peers word the same disclosure
Ask how other companies describe a topic in their reports and read the passage they wrote.
- Answers from the reports, with citations
- The cited page open next to the answer

Related pages
Frequently asked questions
Where do the figures come from?
From the companies' own annual reports, interim reports and SEC filings. Every figure links to the report page it was taken from.
Which companies can I compare with?
Public companies in the United States, Finland and Sweden, in the same data model, so a Nordic company can be compared with a US peer.
Can I share what I find?
Yes. Turn figures into Visual Story cards with the source marked on each card, or collect findings in a workspace and export them to PDF, Word or Excel.

Start a 7-day free trial.
Search filings, retrieve financials and build source-backed analysis.
Start a free trial