

Financial data infrastructure for financial research.
Find, compare and explore 5,000+ listed companies across the Nordics and the US. Every figure and claim comes straight from the original filings.
Use Clarifo in Claude, ChatGPT, through the API, or directly on the Clarifo platform.
 Apple
Apple Microsoft
 NVIDIAAmazon
 AlphabetMeta
 Tesla
Tesla JPMorgan Chase
 Nokia
Nokia Walmart
 FortumExxonMobilVisaMastercardSalesforceAdobeNetflixAMDIntelGoldman SachsAppleMicrosoftNVIDIAAmazonAlphabetMetaTeslaJPMorgan ChaseNokiaWalmartFortumExxonMobilVisaMastercardSalesforceAdobeNetflixAMDIntelGoldman SachsAppleMicrosoftNVIDIAAmazonAlphabetMetaTeslaJPMorgan ChaseNokiaWalmartFortumExxonMobilVisaMastercardSalesforceAdobeNetflixAMDIntelGoldman Sachs
One trusted source for financial data
Clarifo brings financials, company filings and source-linked evidence together in one place — without switching between tools.

Use Clarifo with your AI
Clarifo is available as a built-in connector in Claude, one click to enable. Also works in ChatGPT, Cursor and other MCP-compatible tools.
Add to Claude →Build with Clarifo
Use the Data API to add company financials, filing search, peer comparisons and source-backed research to your own product or agent.
Explore the API →Research in the browser
Search filings, explore company financials and create analyses directly in Clarifo without configuring an external tool.
Open Clarifo →Built for evidence, not plausible answers.
Financial statements and key metrics
Income statement, balance sheet, cash flow and key metrics in a consistent shape from every listed company. Compare peers and periods side by side.
Annual and interim reports
Search and read original filings and stock-exchange releases — years of history and the latest updates as they land.
Traceable outputs
Citations and source context so every number and claim can be reviewed against the original filing.
What you can do with Clarifo
Try any of these directly in Claude, Cursor or the Clarifo browser workspace.
Review quarterly earnings with sources
Trace revenue changes, margin shifts and guidance updates back to the filing page they came from.
Compare peers across periods
Pull comparable metrics for any set of companies and see the underlying numbers side by side.
Research reporting standards and disclosures
Find how specific companies handle a disclosure requirement, with the exact filing reference.
Build with structured financial data
Add financials in a consistent shape, filing search and source-backed evidence to your own product or agent.
Or use Clarifo directly in the browser
Search filings, chat with sourced answers, and turn any analysis into a shareable report. Same data layer, no configuration.
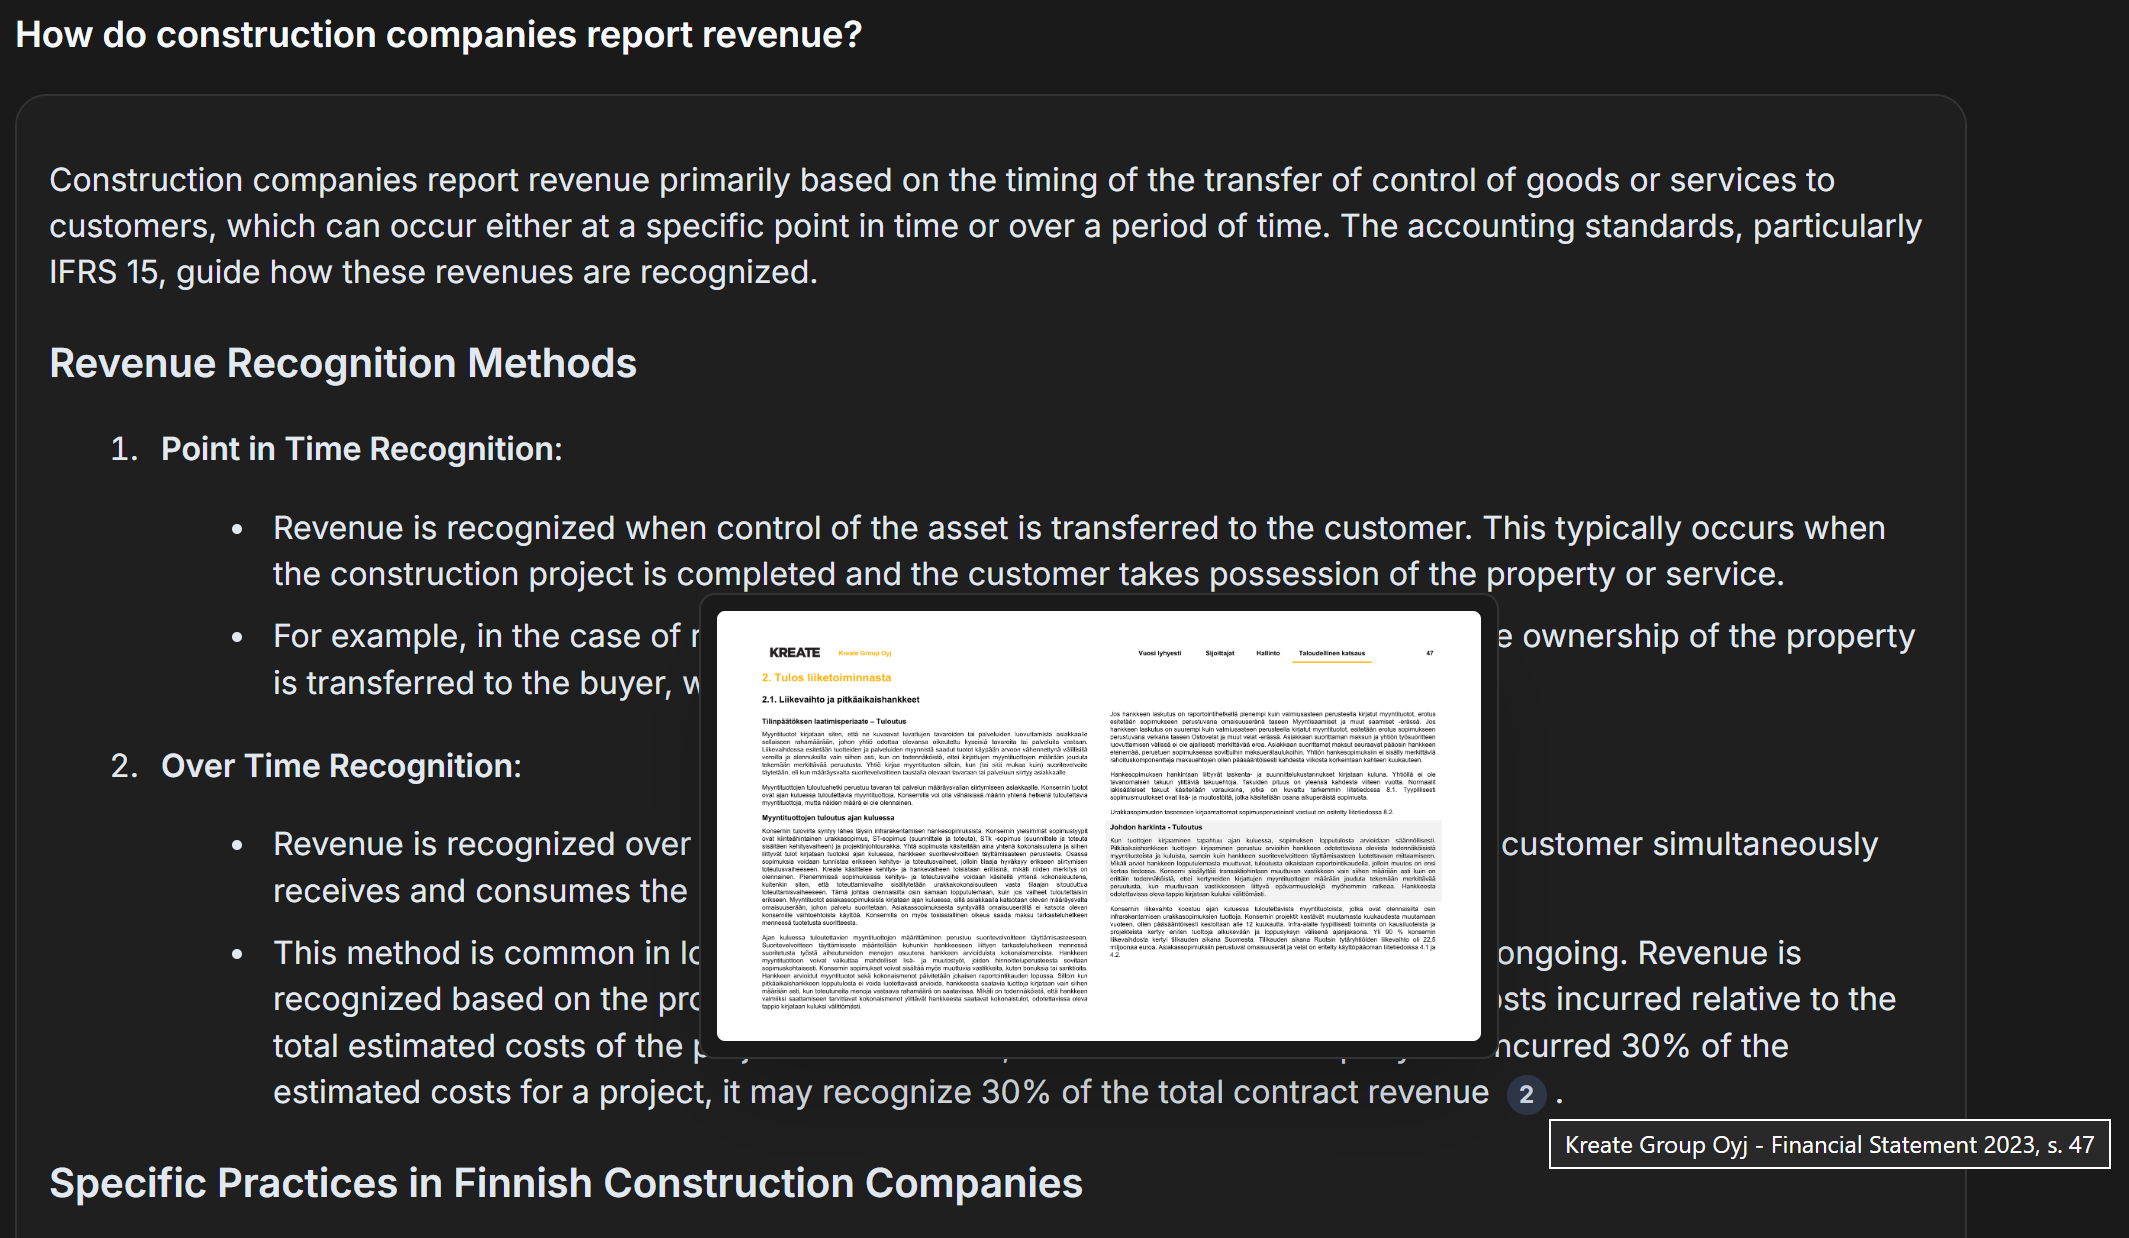
Browse listed companies and search filings in plain language, filtered by company, year or quarter.
Financial data across 5,000+ listed companies
Covering the United States, Finland and Sweden, with more markets being added.

Give your finance team data it can cite.
Start a 14-day Pro trial. Search filings, retrieve financials and build source-backed analysis.