
Nvidia financial analysis often begins with the same four figures: revenue growth, gross margin, earnings per share and management guidance. They matter, but they do not explain the business on their own. At Clarifo, we use company filings, historical financial data and peer comparisons to understand what is changing behind the headline numbers — and which changes may prove durable.
That distinction matters because Nvidia is no longer just a graphics processor story. It sells accelerated-computing systems, networking technology, software and a broader platform for building and operating AI infrastructure. Investors need to know not only how much Nvidia sells, but who is driving demand, which activities support profitability and how product transitions, supply commitments and customer concentration affect the outlook.
Start with Nvidia's Form 10-K and latest Form 10-Q. Then connect the income statement, revenue breakdown, cash flow, disclosures and semiconductor peer group. Clarifo helps us retrieve and compare that evidence without losing the links back to the source documents.
Start with Nvidia's financial statements, not the market narrative
To understand Nvidia's financial performance, we first establish the annual trend. Revenue rose from $27.0 billion in fiscal 2023 to $215.9 billion in fiscal 2026. Operating income increased from $4.2 billion to $130.4 billion over the same period. Operating cash flow grew from $5.6 billion to $102.7 billion. Those changes are visible in Nvidia's FY2023 and FY2026 annual filings.
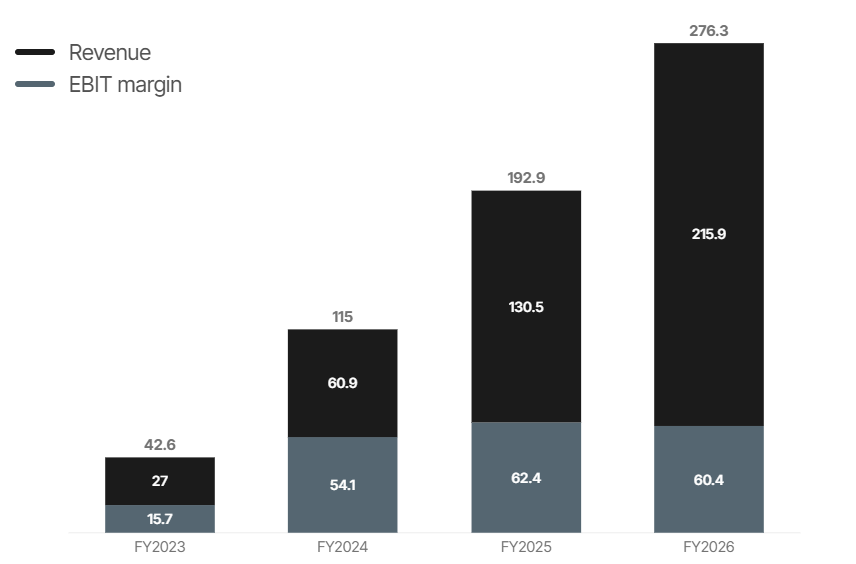
The next question is not simply whether revenue grew. It is whether profitability and cash generation moved with it. Nvidia's operating margin expanded dramatically between FY2023 and FY2025, but eased from 62.4% in FY2025 to 60.4% in FY2026. Growth remained exceptional, yet the margin trend already shows why an investor should read more than the top line.
We then place the annual figures next to the latest quarter. For the quarter ended July 26, 2026 (Q2 of fiscal 2027), Nvidia reported revenue of $96.2 billion, up 106% year over year. Its reported GAAP gross margin was 75.0%. These are quarterly figures, not a new full-year total, and should be compared with the corresponding quarter rather than treated as directly comparable to annual revenue. Source: Nvidia Q2 FY2027 earnings release.
Break down Data Center revenue — and understand the reporting structure
Data Center is central to the Nvidia investment case. In Q2 FY2027, the company reported $89.0 billion in Data Center revenue, approximately 92.5% of its $96.2 billion total. Data Center revenue increased 117% year over year, supported by its Blackwell Ultra infrastructure ramp. Source: Nvidia Q2 FY2027 Form 10-Q.
Total revenue: $96.2B Data Center: $89.0B Data Center share: ~92.5%
There is an important reporting distinction here. Nvidia's two reportable operating segments are Compute & Networking and Graphics. Data Center is a market platform within its revenue disclosures, not a third reportable operating segment. Confusing the two can lead to misleading comparisons of segment margins and product demand. The distinction is described in Nvidia's FY2026 Form 10-K and Q2 FY2027 Form 10-Q.
We use Clarifo's company and segment research tools to keep these categories separate and compare them over time. That is particularly useful when disclosure categories change. Nvidia revised its market-platform presentation in Q1 FY2027 and recast comparative figures; in Q2 it also reclassified a customer between market-platform categories. Those changes do not automatically mean the underlying economics changed by the same amount. Source: Q2 FY2027 filing.
A strong headline tells us how fast Nvidia is growing. The revenue mix tells us how concentrated that growth has become.
Follow margins and cash flow to test the quality of growth
Revenue growth does not translate into shareholder value at a fixed rate. We check gross margin, operating margin and operating cash flow together, because each answers a different question. Gross margin reflects product pricing, manufacturing costs and mix. Operating margin also captures the expense of running and developing the business. Cash flow provides an additional test of how reported profitability translates into cash.
Nvidia's annual GAAP gross margin moved from 75.0% in FY2025 to 71.1% in FY2026, even as annual revenue increased. By Q2 FY2027, quarterly GAAP gross margin was back at 75.0%. The figures show why it matters to distinguish an annual trend from a quarterly recovery and to examine product mix, supply conditions and charges rather than assuming that every margin change is permanent. FY2026 10-K · Q2 FY2027 earnings release.
Operating cash flow is just as important. Nvidia generated $102.7 billion in operating cash flow in FY2026, compared with $64.1 billion in FY2025. We read that change beside working-capital movements, inventory and supply commitments, not as a substitute for them. A growing business can generate considerable earnings while tying up more cash in inventory, receivables or contractual obligations. Source: Nvidia FY2026 Form 10-K.
Read customer concentration and AI-cloud commitments in the notes
Some of the most consequential information in an Nvidia financial analysis sits outside the income statement. The Q2 FY2027 filing states that one direct customer accounted for 16% of quarterly revenue. It also distinguishes direct customers from indirect end customers — an important difference when equipment is purchased by an intermediary but ultimately deployed for a cloud provider, model developer or enterprise. Source: Nvidia Q2 FY2027 Form 10-Q.
The same filing describes a new model with selected AI-cloud partners. Under these arrangements, partners purchase Nvidia data-center infrastructure while Nvidia commits to cloud-service agreements. Nvidia disclosed approximately $36 billion of commitments under those agreements as of July 26, 2026. These commitments are not the same thing as recognized revenue; they are contractual obligations that investors should examine alongside the commercial rationale, customer demand and associated risks. Source: Q2 FY2027 Form 10-Q, commitments and MD&A.
We also pay attention to supply-chain dependence, product transitions, export controls, inventory provisions and the pace at which customers build and utilize AI capacity. Management's disclosures can reveal risks that are not visible in a single quarter's revenue growth rate. The objective is not to assume these risks will materialize, but to understand what could make the next period look different from the last.
Compare Nvidia with AMD and Intel — without pretending the businesses are identical
Nvidia should not be assessed only against its own past. We use Clarifo's peer comparison capabilities to place its reported financials beside other semiconductor companies, including AMD and Intel. This gives us a useful reference point for growth, gross margin and operating profitability — provided we acknowledge the differences in fiscal calendars and business models.
| Company / fiscal year | Revenue | Gross margin | Operating margin |
|---|---|---|---|
| Nvidia FY2026 | $215.9B | 71.1% | 60.4% |
| AMD FY2025 | $34.6B | 49.5% | 10.7% |
| Intel FY2025 | $52.9B | 34.8% | -4.2% |
The gap is striking, but it does not by itself measure competitive advantage or future returns. Nvidia's current revenue mix is unusually concentrated in AI infrastructure, while AMD and Intel have different product portfolios, manufacturing exposures and expense structures. We therefore use peer comparisons to identify questions — such as how much of the margin difference comes from mix or scale — rather than to assign a verdict from one table.
Connect Nvidia's results to the economics of AI infrastructure spending
Nvidia is frequently treated as a proxy for AI demand. That is understandable: sales of accelerators and networking equipment are one visible side of the data-center investment cycle. But Nvidia's recognized revenue and a cloud provider's eventual return on invested capital are not the same event.
When a customer purchases AI infrastructure, Nvidia may record the sale well before the customer earns an adequate economic return on the equipment. That timing difference helps explain why strong supplier results can coexist with rising capital expenditure and cash-flow pressure at some infrastructure buyers. We explore the broader relationship in our analysis of AI capex versus cash flow.
For Nvidia itself, the analytical question becomes more specific: how broad is the final demand, how dependent is the growth on a limited group of buyers, and what happens to utilization, replacement cycles and order patterns when customers move from building capacity to earning returns on it?
How we use Clarifo to keep Nvidia research source-linked
Our workflow begins with Clarifo's financial research platform. We retrieve Nvidia's annual and quarterly figures, compare its revenue and margins over time, look at its product and market-platform disclosures, and search the original filing text for customer concentration, supply commitments and other material risks. Then we compare the same financial measures with selected semiconductor peers.
The practical benefit is not that Clarifo produces one definitive answer about Nvidia stock. It is that the evidence is easier to inspect: financial trends and peer comparisons remain connected to the SEC filings used to produce them. Readers can also run this research workflow through the Clarifo plugin for ChatGPT.
Compare Nvidia's last four annual reports with its latest 10-Q. Show revenue, gross margin, operating margin and operating cash flow, explain what changed in Data Center, and link each material finding to the original filing.
That makes it easier to challenge an investment thesis with evidence instead of accepting a headline or a narrative at face value.
What to watch in Nvidia's next results
We would keep five issues in view: the pace and mix of Data Center growth; gross margin through the Blackwell-to-Rubin transition; cash flow relative to reported earnings; changes in direct and indirect customer concentration; and the size and structure of AI-cloud and supply commitments. Each is a different test of whether Nvidia's growth is broadening, stabilizing or becoming more dependent on particular customers and deployment cycles.
Nvidia's latest available results are extraordinarily strong. The reason to study the filings is not to discount those results. It is to understand why they are strong, what the company must execute next, and which disclosures might signal a meaningful change before that change becomes obvious in the headline numbers.
Financial figures and disclosures in this article are based on publicly available filings and earnings materials available as of October 20, 2026, retrieved and compared using Clarifo. Nvidia's fiscal 2027 Q2 ended July 26, 2026. Peer fiscal years do not end on precisely the same date. This article is for information and research, not investment advice.
Go beyond headline earnings. Explore Nvidia's SEC filings, compare financial trends and research semiconductor peers with source-linked evidence in Clarifo.